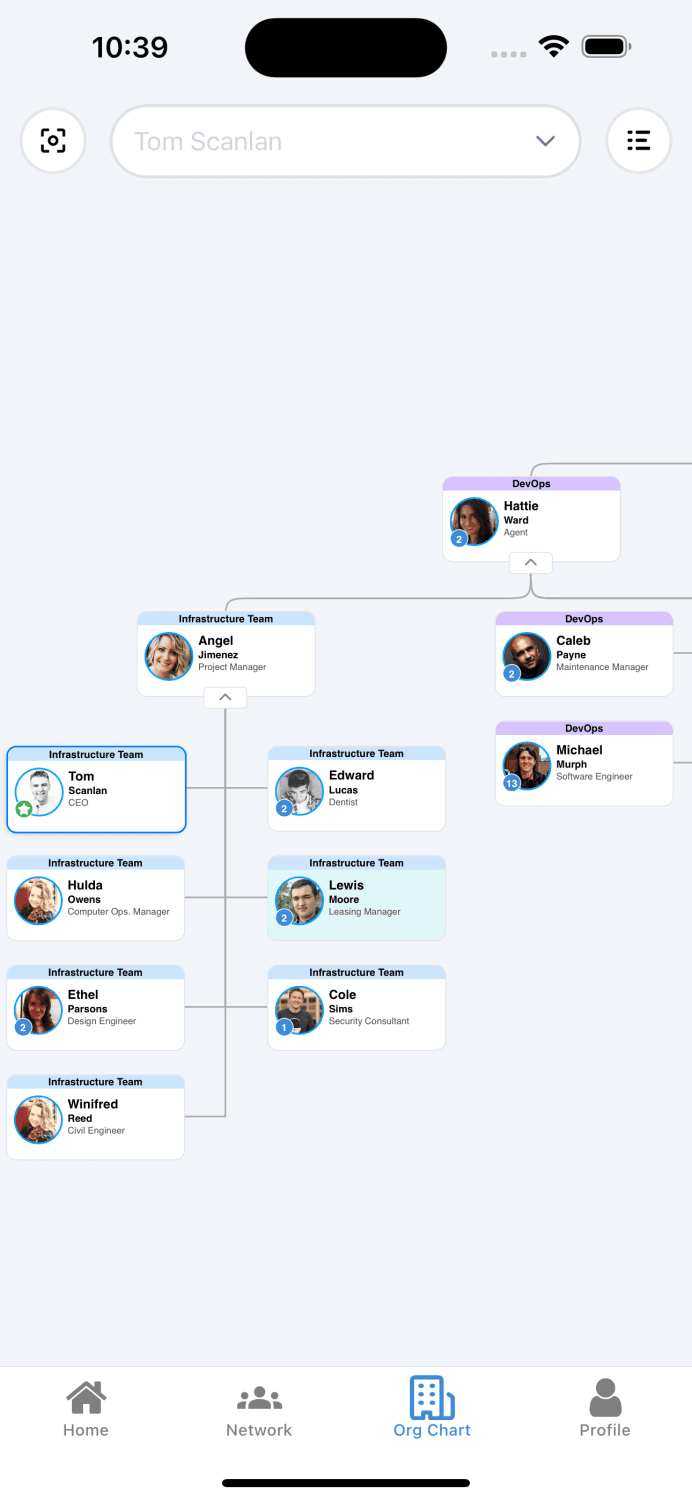
How InCommon built the first true org chart for mobile
Dec 3, 2024

Tom Scanlan
CEO
At InCommon, we’re on a mission to redefine how people connect at work, and this extends to every detail of our app—including how teams and organizations are visualized. One of our most exciting recent developments is the creation of what we believe to be the first true org chart experience for mobile.
Here’s the problem we set out to solve: If your company is lucky, you might have access to an org chart. But even then, it’s often buried in some hard-to-navigate tool or document. Worse, mobile versions of org charts are usually stripped-down lists, losing the intuitive, visual clarity of their web-based counterparts.
That didn’t sit right with us. We wanted users to have the same powerful, interactive experience on mobile as they do on the web—and then some. Something they could zoom in and out of to explore just like you would a map on your phone. Here’s how we made it happen.
Leveraging the Latest Technology
The breakthrough came with React Native Expo 52 and its support for DOM Components. These components allowed us to adapt the D3-powered org chart from our web app and bring it seamlessly to mobile.
This wasn’t a simple copy-paste job. We optimized the D3 chart for performance and touch interactions, ensuring it could handle the dynamic needs of mobile users. The result? A fully interactive org chart that feels as fluid and engaging as exploring a map.

Setting Up DOM Components
DOM Components in Expo allow developers to use existing web code within a native environment. By adding the "use dom" directive at the top of a web component, we could render our D3-powered org chart in a mobile-friendly way. This is a game-changer for maintaining consistent codebases across platforms. Especially for a tool like D3, which does not have large open source alternatives built for React Native.
We took our D3 org chart component and integrated it directly into the mobile app like so:
We chose to use d3-org-chart as it gave us the most versatility in creating a custom org chart. You simply need to instantiate the org chart whenever the data changes (first load, opening branches, searching users). As you can see, this code is returning a `div`. This would normally never be able to run a React Native app.
Integrating with Native Code
On the native side, we wrap the web component and manage props asynchronously. DOM Components rely on a bridge that sends serializable props to the DOM component. This allowed us to handle dynamic updates, such as toggling nodes or zooming into specific areas of the chart.
Be careful (as we learned the hard way) you can't expect your dom component to have access to any existing state system you have. The bridge sitting between native and web requires you to pass it in as props. So this component file might become rather large if your chart requires a lot of data that you currently have sitting in state.
In order to get some of the native features like haptics and sounds to work, you will also need to pass these in to your dom component as functions via props. But doing so allows you to build apps that seem impossible to build now by leveraging existing web technologies.
Lessons Learned
1. Performance Optimization: DOM Components run inside a WebView, so optimizing D3 rendering was crucial for maintaining smooth interactions.
2. Shared Codebase: Using the same D3 component for both web and mobile reduced redundancy and improved maintainability.
3. Consistency Across Platforms: Thanks to Expo’s DOM Components, users get the same experience across web and mobile, including interactive zooming and commonality displays.
Special thanks to the Expo team for creating this dom component bridge system. We had built our own internal way of doing this last year while building another app. But Expo makes it smooth to implement things like this without creating your own iFrame event listener system. Fortunately for us, they added this feature to the Expo 52 Beta just as we were about to reimplement it for the InCommon project.
Want to see the org chart in action? Book a live demo.